CPET Test Interpretation, Part 4: Interpretation and Summary

After having gone through the descriptive checklists for ventilatory, gas exchange and circulatory limitations the reason(s) for a patient’s exercise limitation, if any, should be reasonably clear. However, one of the first questions that should be asked when reading an exercise test is what was the purpose of the test?

  • Maximum safe exercise capacity for Pulmonary Rehab?
  • Rule in/rule out exercise-induced bronchospasm?
  • Pre-operative assessment?
  • Dyspnea of uncertain etiology?
  • What is the primary limitation to exercise (pulmonary or cardiac)?
  • Is deconditioning suspected?

The interpretation and summary should address these concerns.

The descriptions checklist is the main groundwork for the actual interpretation and any abnormal findings there may signal the need for specific comments. The interpretation should start by indicating whether or not the patient’s exercise capacity was normal and then should indicate the presence or absence of any limitations.

What was the patient’s maximum exercise capacity (maximum VO2)?

  • >120% = Elevated
  • 80% to 120% = Normal
  • 60% to 79% = Mildly reduced
  • 40% to 59% = Moderately reduced
  • <40% = Severely reduced

Example: There was a {elevated | normal | mildly reduced | moderately reduced | severely reduced} exercise capacity as indicated by the maximum oxygen consumption of XX%.

Continue reading
2019 ATS/ERS Spirometry Standards

The 2019 ATS/ERS Spirometry Standards were recently released. The standards are open-access and can be downloaded without charge from the October 15th issue of the American Journal of Respiratory and Critical Care Medicine. Supplements are available from the same web page.

The 2019 Spirometry Standards have been extensively re-organized with numerous updates. Notably, a number of sections that were previously discussed in the 2005 General Considerations for Lung Function Testing have been updated and included in the 2019 Spirometry Standards. Also notably, a number of stand-alone spirometry tests, including the Flow-Volume Loop, PEF and MVV are not included in the 2019 Standards.

An overview of changes and updates from the 2005 Spirometry Standards are detailed within the 2019 Spirometry Standards (page e71, column 1, paragraph 2) and in the Data Supplement (pages E2-E3). In more detail these include:

◆ The list of indications for spirometry (page e73, table 1) was updated primarily with changes in language.

  • “To measure the effect of disease on pulmonary function” was updated to “To measure the physiological effect of disease or disorder”
  • “To describe the course of diseases that affect lung function” was updated to “To monitor disease progression”
  • “To monitor people exposed to injurious agents” was updated to “To monitor people for adverse effects of exposure to injurious agents”

◆ Items added to indications:

  • “Research and clinical trials”
  • “Preemployment and lung health monitoring for at-risk occupations”

◆ Contraindications were previously mentioned in the 2005 General Considerations rather than the 2005 Spirometry Standards and these have been extensively updated and expanded. Although the list of contraindications (page e74, table 2) is fairly inclusive (and should be reviewed by all concerned) there were items mentioned in the body of text that were not in the table:

  • “Spirometry should be discontinued if the patient experiences pain during the maneuver.”
  • “…because spirometry requires the active participation of the patient, inability to understand directions or unwillingness to follow the directions of the operator will usually lead to submaximal test results.”

◆ Notably, abdominal aortic aneurysm (AAA) was not included as a contraindication in the 2019 standards. (page e72, column 3, paragraph 1)

Continue reading

CPET Test Interpretation, Part 3: Circulation

I would like to re-emphasize the importance of the descriptive part of CPET interpretation. At the very least consider it to be a checklist that should always be reviewed even when you think you know what the final interpretation is going to be.

After gas exchange, the next step in the flow of gases is circulation. The descriptive elements for assessing circulation are:

What was the maximum heart rate?

The maximum predicted heart rate is calculated from 220 – age.

A maximum heart rate above 85% of predicted indicates that there has been an adequate exercise test effort.

Example: The maximum heart rate was XX% of predicted {which indicates an adequate test effort}.

What was the heart rate reserve?

The heart rate reserve is (predicted heart rate – maximum heart rate). A heart rate reserve that is greater than 20% of the (predicted heart rate – resting heart rate) is elevated and may be an indication of either chronotropic incompetence or an inadequate test effort.

Note: A negative heart rate reserve will occur whenever a patient exceeds their predicted heart rate.

Example: The heart rate reserve is XX BPM which is {within normal limits | elevated}.

Continue reading

CPET Test Interpretation, Part 2: Gas Exchange

I would like to re-iterate the importance of the descriptive part of CPET interpretation. At the very least consider it to be a checklist that should always be reviewed even when you think you know what the final interpretation is going to be.

After ventilation, the next step in the flow of gases is gas exchange. The descriptive elements for assessing gas exchange are:

What was the maximum oxygen consumption (VO2)?

The maximum oxygen consumption is the prime indicator of exercise capacity. Predicted values should be based on patient height, age, weight and gender.

Note: There is actually a surprising limited number of reference equations for maximum VO2. The only one I’ve found that takes weight into consideration in a realistic manner is Wasserman’s algorithm. Some test systems do not offer this reference equation but I feel it is worthwhile for it to be calculated and used regardless. See appendix for the algorithm.

Note: The maximum VO2 does not necessarily occur at peak exercise (i.e. test termination). This can happen in various types of cardiac and vascular diseases but also because the patient may decrease the level of their exercise before the test is terminated.

  • Maximum VO2 > 120% of predicted = Elevated
  • Maximum VO2 = 80% to 119% of predicted = Normal
  • Maximum VO2 = 60% to 79% of predicted = Mild impairment
  • Maximum VO2 = 40% to 59% of predicted = Moderate impairment
  • Maximum VO2 < 40% of predicted = Severe impairment

Example: The maximum VO2 was X.XX LPM { which is {mildly | moderately | severely } decreased | within normal limits | elevated}.

Continue reading

CPET Test Interpretation, Part 1: Ventilatory response

I’ve always found interpreting CPET tests to be one of the more interesting (and enjoyable) things I’ve done. Interpreting a CPET test is both more difficult and easier than interpreting regular PFTs. More difficult because there are a lot more parameters involved and easier because determining test adequacy and the primary cause(s) of an exercise limitation tends to be clearer.

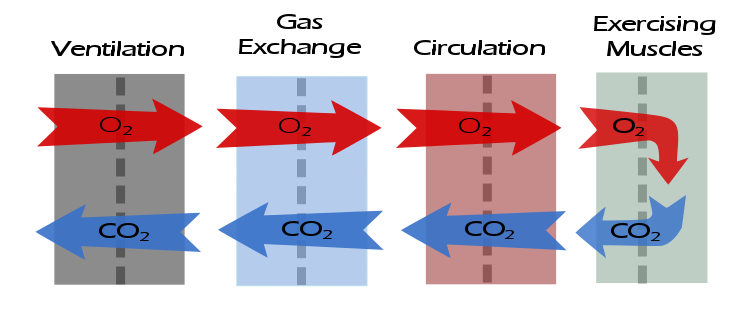
I’ve found that you have to go back to basic physiology whenever you interpret CPETs and that always boils down to the flow of oxygen and carbon dioxide.

Abnormalities in gas flow that occurs at any of these steps will leave a distinctive pattern in the test results. I’ve developed a structured approach to interpreting CPET results that includes a descriptive part as well as the interpretation and summary. The descriptive part may appear to be tedious but I’ve always found it to be absolutely critical to the actual interpretation.

The descriptive elements for assessing the ventilatory response to exercise are:

What was the baseline spirometry?

Note: Spirometry pre- and post-exercise should always be performed as part of a CPET, even when exercise-induced bronchoconstriction is not suspected. This is so that normal values for the ventilatory response to exercise can be determined.

Example: The FVC was {normal | mildly reduced | moderately reduced | moderately severely reduced | very severely reduced}. The FEV1 was {normal | mildly reduced | moderately reduced | moderately severely reduced | very severely reduced}. The FEV1/FVC ratio was was {normal | mildly reduced | moderately reduced | severely reduced}.

What was the post-exercise change in FEV1?

A decrease in FEV1 ≧ 15% following exercise is abnormal and suggests exercise-induced bronchoconstriction.

Note: FEV1 can increase post-exercise and an increase up to 5% is normal. Some patients with reactive airway disease bronchodilate with exercise and can an increase ≧ 15% from baseline, particularly if they were obstructed to begin with. Although strictly speaking this is not abnormal, it does suggest the presence of labile airways.

Example: There was {a significant decrease / no significant change / a significant increase} in FEV1 following exercise.

Continue reading

Sharing opinions with Paul Enright

Dr. Paul Enright is a well-known name in the field of Pulmonary Function testing. He is the lead author or co-author of over a hundred articles and has served on many of the ATS/ERS standards committees.

Introduction:

We both retired in southern Arizona and live a couple of towns apart from each other. We have corresponded for a while but met face-to-face only recently. We both drive small red vehicles, Richard a Ford Transit Van and Paul a Prius Compact. We both love to visit National Parks; Richard’s favorite is Canyonlands while Paul’s favorite is Jasper, with many large wild animals. This posting is based on a set of suggestions by Paul.

In which hospital-based PFT labs have you worked?

Richard: St. Elizabeth’s then Beth Israel Deaconess Medical Center, both in Boston.

Paul: I started a very small PFT lab at the Kuakini Hospital in Honolulu; then the basement lab of the National Jewish Hospital in Denver, Colorado; then the Plummer Building of the Mayo Clinic in Rochester Minnesota; then the University Medical Center in Tucson, Arizona; then a NIOSH van running out of Morgantown, West Virginia.

Which is the largest PFT lab that you ever visited?

Richard: the PFT Lab at Mass General in Boston.

Paul: INER in Mexico City, where they test more than 10,000 patients per year. The medical director of the lab is my friend Laura G. One year a guard with a shotgun stood outside the lab because the payroll with bonuses for the institution was stolen the previous month (December).

Continue reading

N2 washout is affected by N2 excretion and other factors

The Lung Clearance Index (LCI) was first described in 1952 by Margaret Becklake, and is defined as the number of lung volume turnovers required to reduce the concentration of a tracer gas by a factor of 40. LCI is calculated as the cumulative exhaled volume (CEV) during the washout divided by the functional residual capacity (FRC).

Clinically LCI has been used most often in individuals with cystic fibrosis and this is because the LCI has been repeatably shown to be sensitive to changes in airway status that are not reflected in the FEV1. LCI has shown similar results in patients with primary ciliary dyskinesia. As expected LCI has also been tested on patients with COPD, bronchiectasis and asthma although these patients tend to show a better correlation between FEV1 and LCI.

LCI has been performed using a wide variety of tracer gases including helium, methane, argon, nitrogen and sulfur hexaflouride (SF6). The commercial systems that are currently available use either N2 or SF6. N2 washout LCI has recently received a great deal of criticism and some of these criticisms seem to apply to N2 washout lung volumes as well.

Most specifically, a number of studies have noted that the N2 washout FRC is routinely higher than the SF6 FRC and plethysmographic FRC. In addition, the N2 washout LCI tends to be significantly higher than the SF6 LCI and this difference increases as LCI increases.

As examples in a study of patients with COPD the N2 washout FRC averaged 14% higher than the plethysmographic FRC. In other studies of normal subjects the N2 washout FRC was on average 0.20 to 0.21 L higher than plethysmographic FRC. Finally, a study that performed N2 and SF6 washouts simultaneously on CF patients and healthy controls showed the N2 washout LCI to be on average 7.93% higher than SF6 in the healthy controls and 29.13% higher than SF6 in the CF patients. In the same study N2 washout FRC was 12.66% higher than SF6 FRC in the healthy controls and 30.09% higher than SF6 FRC in CF patients.

So why is there such a discrepancy?

Continue reading

FEV1 and VC should be measured separately

The FEV1 and VC both provide quite different information about a patient’s lungs. Unfortunately, spirometry as it is currently practiced is optimized towards generating an accurate FEV1 more than an accurate VC. This is partly due to limitations in the maneuver itself and partly due to the lack of accurate end-of-test criteria for an adequate VC. In one sense this is okay since more than one person that I’ve known and respected has said that “it’s all about the FEV1”.

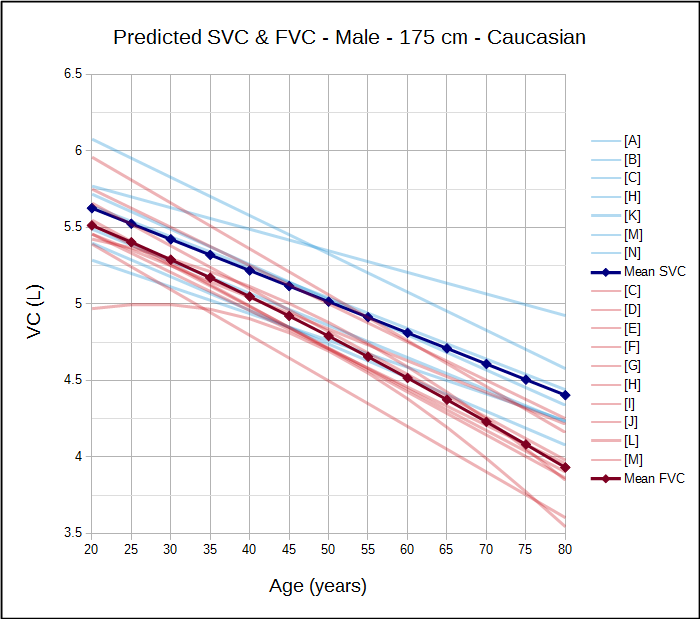
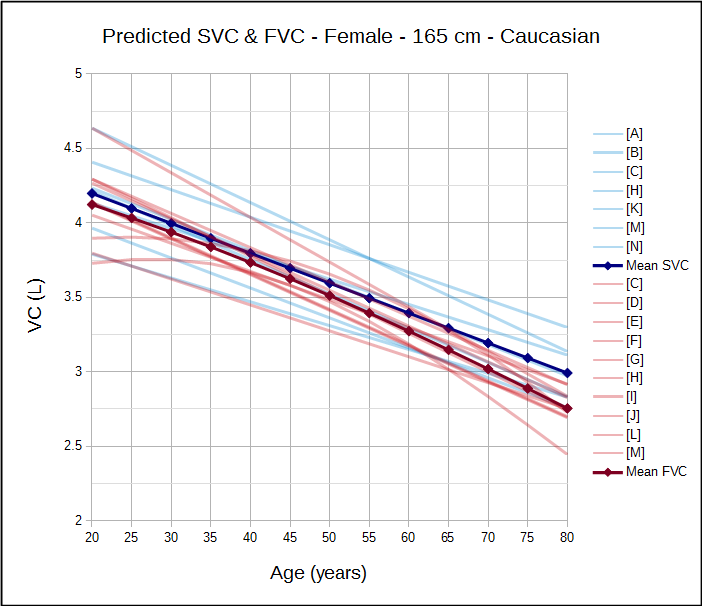
Having said that, an accurate FEV1/VC ratio is essential for detecting and quantifying airway obstruction and an SVC maneuver is more likely to obtain a more accurate VC. This matters because the current ATS/ERS spirometry guidelines recommend that the FEV1/VC be reported, where the VC is the largest value obtained from any test and reference equations indicate that the SVC is routinely larger than the FVC:

So, shouldn’t we be routinely performing both FVC and SVC maneuvers when we do spirometry on our patients? And why aren’t we?

Continue reading

I’M BACK, SORT-OF

The chemo did a real number on me. I was included in a study of a new drug and it literally almost killed me. Twice. For this reason I have left the study and have been put on a gentler and more normal regime of chemo. I have lost a lot of stamina (and strength and weight) but have recovered somewhat. I have returned to catch up on comments as best I can and apologize for not responding for so long.

If possible I will post something new but it will probably be a while before I feel up to doing so.

Thanks to everybody for their kind and supportive thoughts.

Goodbye

This is probably the last post I will be able to write.  I was diagnosed less than two months ago with a very nasty cancer with a poor prognosis.  I thought I could power through it but a serious infection with sepsis and a week and a half stay in the hospital has convinced me that it’s time to quit and focus on other things.

Sucks, but that’s life.

There are many pulmonary function topics I would have liked to discuss but time has run out.  I will leave you to ponder the two biggest elephants in the room; that of height and that of ethnicity.  The relationship between height and FVC, TLC, etc. is inexact and yet nobody seems to think about any alternate anthropomorphic measurements.  Sitting height is only marginally better but it is better.  Is anybody using it?  No.  C’mon people, it’s way past time that we found better anthropomorphic correlations for FVC, FEV1, TLC and DLCO.

And what the heck is ethnicity?  Where is there a definition for it?  Although I applaud the GLI efforts for more universal FVC reference values they included fudge factors for ethnicity.  Fudge factors!!??.  It’s time that the concept of ethnicity was dropped and better (see above) anthropomorphic correlations were made.

Keep learning.  Keep questioning.

Goodbye.

– UPDATE – 

Continue reading